Vienna - CityTransit Data
Home to nearly two million people, the Austrian capital has long been a pioneer in integrating land use and transport planning to make sustainable modes the preferred choice of travel. The continuous expansion of the metro system underscores this commitment despite the challenges posed by the Covid-19 pandemic.

Main indicators
Introduction
What is the modal share of sustainable modes in the city? And how much infrastructure is exclusively dedicated to public transport? Find out here the main figures on the city's public transport networks and sustainable mobility.
Number of public transport stops
The indicator shows the number of individual stops/stations where regular public transport services are allowing passengers to get on or off the vehicles. A station is signalled in a clear way to the potential users, including by listing the routes/lines stopping there, and is usually referred to by a unique name.
Values are shown in stops/100,000 inhabitants.
297 Per 100K inhabitants
Compare dataModal share of sustainable modes
The indicator captures the percentage of all the daily trips in the area undertaken primarily using sustainable travel modes: i.e. on foot, by bicycle, by public transport and by taxi.
73 %

Length of dedicated PT operational infrastructure
The indicator reflects the length of the exclusive sections along which regular private car traffic is not allowed to use the same space travelling in the same direction.
Values per mode show the absolute length in km of infrastructure.
119 km Per M inhabitants
Compare dataFleet of public transport vehicles
The indicator counts the number of vehicles registered to public transport operators to provide regular public transport services in the metropolitan area.
As vehicles are entering the fleet and being taken out of service at multiple times during the year, we are showing the effective fleet available for service at the end of the year, thus after all such fluctuations and changes have occurred.
Values are shown in vehicles/million inhabitants.
1,203 Per M inhabitants
Compare dataAnnual public transport ridership
The number of annual public transport journeys is the number of annual boardings in public transport vehicles (all modes and all operators within the metropolitan area are concerned).
Values are shown in journeys/million inhabitants.
345.11 Journeys per inhabitant
Compare data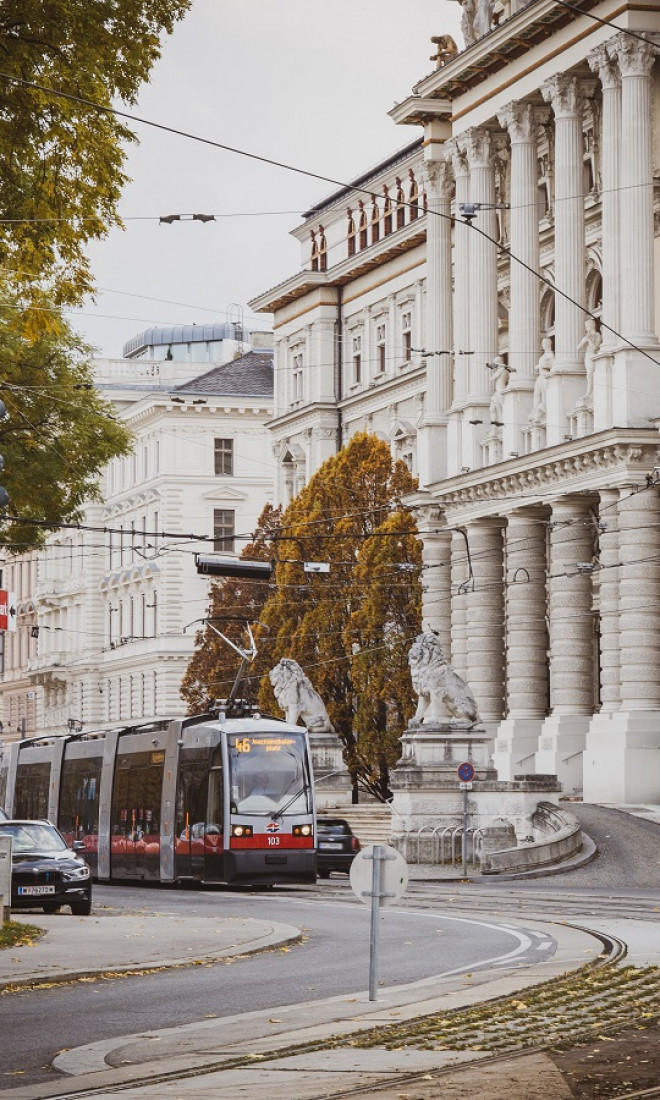
Collective & shared mobility options
This indicator shows the transport modes available in the city, referring to vehicles and modes that are not privately owned by an individual and can – under conditions – be in principle available to all adult residents. The maximum value of the indicator is 11, the full list of modes possibly considered being: Bus, Trolleybus, Tram, Metro, Suburban rail, Ferry, Taxi and TNCs, Shared cars, Shared bicycles (electric or not), Shared mopeds, Shared scooters (electric or not).
9 modes
Compare dataVehicle-kilometres in operations
This indicator refers to the annual distances covered by public transport services, excluding deadhead runs from and to depots). All operators and all public transport modes operated in the metropolitan area are concerned.
Values are shown in VKM supplied/inhabitant.
130 VKM Per inhabitant
Compare dataCovid-19 ridership adjustment
This indicator is recording the impact of the Covid-19 pandemic and public health crisis on the level of public transport use in the city. The ridership level recorded is compared with the one for the most relevant period pre-pandemic and before any restriction had been imposed restricting movement or activities.
Values are shown in percentage of the normal ridership expected without any restrictions in place.
79 %
Cost of a 1-trip public transport ticket
The indicator will record the cost a user will have to pay for the purchase of a single-trip public transport ticket in the city. The values shown reflect the average of two values:
a. the price when only one ticket is being purchased, without any other type of support or discount;
b. the price per ticket using any discount means provided for purchasing in bulk or additional support/platform.
2.40
Price converted from EUR using exchange rates available on .
Scheduled transport
Introduction
Scheduled transport services are those that run on a fixed time-schedule. They include most forms of mass transit, such as bus, light rail, and metro.
Average headway during peak times
The indicator shows the average time in minutes between two consecutive services of the same public transport line/route, running on the same section of the network, during the period considered as peak time
14.73 min
Compare dataCovid-19 change in service
This indicator is recording the impact of the Covid-19 pandemic and public health crisis on the level of public transport provision the city. The supply level is compared with the one for the most relevant period pre-pandemic.
Values are shown as percentages of the VKM normally provided had no restrictions been put in place. 100% signifies service is at full, pre-pandemic levels.
100 %
Covid-19 passenger capacity limits
In many cities the maximum number of people allowed on-board public transport vehicles has been limited to reduce the spread of the virus. Such requirements change frequently, sometimes, but not always, being linked to the severity of the restrictions put in place at any moment
100 %
Average daily ridership during a work day
The indicator shows the average number of passenger journeys recorded on the various public transport modes available in the city during an average working day.
Values are shown in number of passengers.
1,962,000 Journeys per day
Compare dataLength of public transport routes
The indicator refers to the total length of all the public transport regular lines in use during normal operation.
Values are shown in KM/100000 inhabitants.
79 km Per 100K inhabitants
Compare data
Customer satisfaction survey
The indicator shows whether a city’s public transport operating companies or authorities are conducting a regular – generally annual – survey among the residents of the city inquiring about the satisfaction with public transport services.
Yes
Compare dataNumber of Metro routes
This indicator records the number of lines in metro network. When two or more lines share the same infrastructure, the line is counted only once; branch lines are considered when the branch infrastructure is proportionately relevant with regards to the length of the full line.
5
Compare data
Accessibility for people with reduced mobility
The indicator reflects the extent to which the city’s bus and tramway/LRT fleet are adapted for the carriage of such passengers. It refers solely to the reported accessibility of vehicles rather than the entire network and that of installations and buildings. For this reason, metro vehicles (where the mode is available) are considered as accessible and not included.
86 %
Step-free metro station access
The indicator records the share of the metro stations classified by the public transport operators as providing potential customers with step-free access from the street level to the platforms for boarding the trains.
100 %
Multimodal integration
An interchange is any place where a traveller can switch from one mode of travel to another, with a minimum/ reasonable amount of walking or waiting. The more modes available at an interchange, the higher the level of multimodal integration.
The indicator value will be calculated as an average for all the recognised stopping points for long-distance buses, railway and metro in the city.
Coming soon...
Schedule compliance/punctuality
The indicator is looking at the percentage of the services supplied which were delivered in adherence with the schedule agreed to by the public transport operator.
97.13 %
Shared mobility
Introduction
While mass public transport is the backbone of mobility in many cities, shared mobility services, such as bike-sharing or car-sharing, can provide a flexible travel solution for example in the case of the first and last mile. One key differentiation with traditional public transport is that shared services are often provided as a response to the demand from customers.
Number of commercially licensed drivers
The indicator records the number of licences or permits issued by the transport authority in the area for the transport of passengers using small passenger vehicles - taxis or otherwise - within the area.
6,700
Compare dataAverage cost per unit of shared-use modes
The indicator shows the cost a user will have to pay when using any of the shared mobility modes available in the city. If more than one company operates the same mode under the same conditions an average price is calculated.
0.13
Price converted from EUR using exchange rates available on .

Shared mobility vehicles
This indicator counts the number of vehicles in use for shared use in the area according to the different modes used: Shared cars, Shared bicycles (electric or not), Shared mopeds, Shared scooters (electric or not).
Values are shown in vehicles/million inhabitants.
3,810 per M inhabitants
Compare dataIntelligent transport system
Introduction
Sustainable mobility also refers to convenient mobility, where traffic flow can be observed and managed centrally, vehicle arrival times and locations can be predicted for smooth connections, and the integration of the different modes into a single system can be as easy as 1-2-3. Here are some of the indicators that allow this to happen.
Share of stops with arrival information screens
The indicator refers to the share of public transport stops which have a screen or information board providing real time information to passengers regarding arrival and departure times. Metro stops are not taken into account.
16 %
MaaS system in place
The indicator shows whether Mobility as a Service is available in the metropolitan area. Such a MaaS system must have in place an option to plan, book and pay for trips using multiple transport modes in the area using a single platform. These trips should include both public and shared transport modes in the area.
Yes
Compare dataIntelligent transport system objects
The indicator refers to the Intelligent Transport System objects installed and connected to a central traffic management in place in the city. The aim of these objects is to facilitate optimal flow of traffic in the city, inform motorists and all other traffic participants of events, and the respect of the traffic rules applicable.
197 Speed cameras, CCTV, traffic lights
Compare dataSmart card in use
The indicator reflects whether the city has implemented and rolled out a smart card system that can be used as a means of purchasing and paying for public transport trips.
No
Compare dataPublic transport ticket purchase options
The indicator shows the various means available to customers to pay for their fares and purchase tickets as needed. This refers to the means of payment allowed for directly accessing the network.
Where access to the network is being done through a smart card the values here refer to the means available for customers to load/purchase trips onto the card.
3
Compare data
Public transport app
The indicator shows whether a standalone public transport app for smartphone use has been developed for the city in question. Third party apps can be considered if they are specifically designed for public transport use.
Yes
Compare dataDedicated Wi-Fi in Metro vehicles
The indicator shows whether wireless internet connectivity is provided in metro carriages. Modes transporting people on the surface allow 3G, 4G or other type of mobile connection, so they are not taken into account here.
No
Compare dataPrivate transport
Introduction
Even with a good public transport network and convenient shared mobility options at hand, private transport will always remain an option for many citizens.
Length of roads in the area
The indicator refers to all roads open to public traffic (surfaced or non-surfaced) located in the metropolitan area, with the exception of routes and paths through forests and across farmland.
The length of the motorway network is included.
2,834 km
Compare dataPaid parking spaces managed by the city
The indicator refers to the total number of paid parking places which are either on-street or managed directly by the city. Private spots such as commercial or office buildings lots are not included.
220,000
Compare data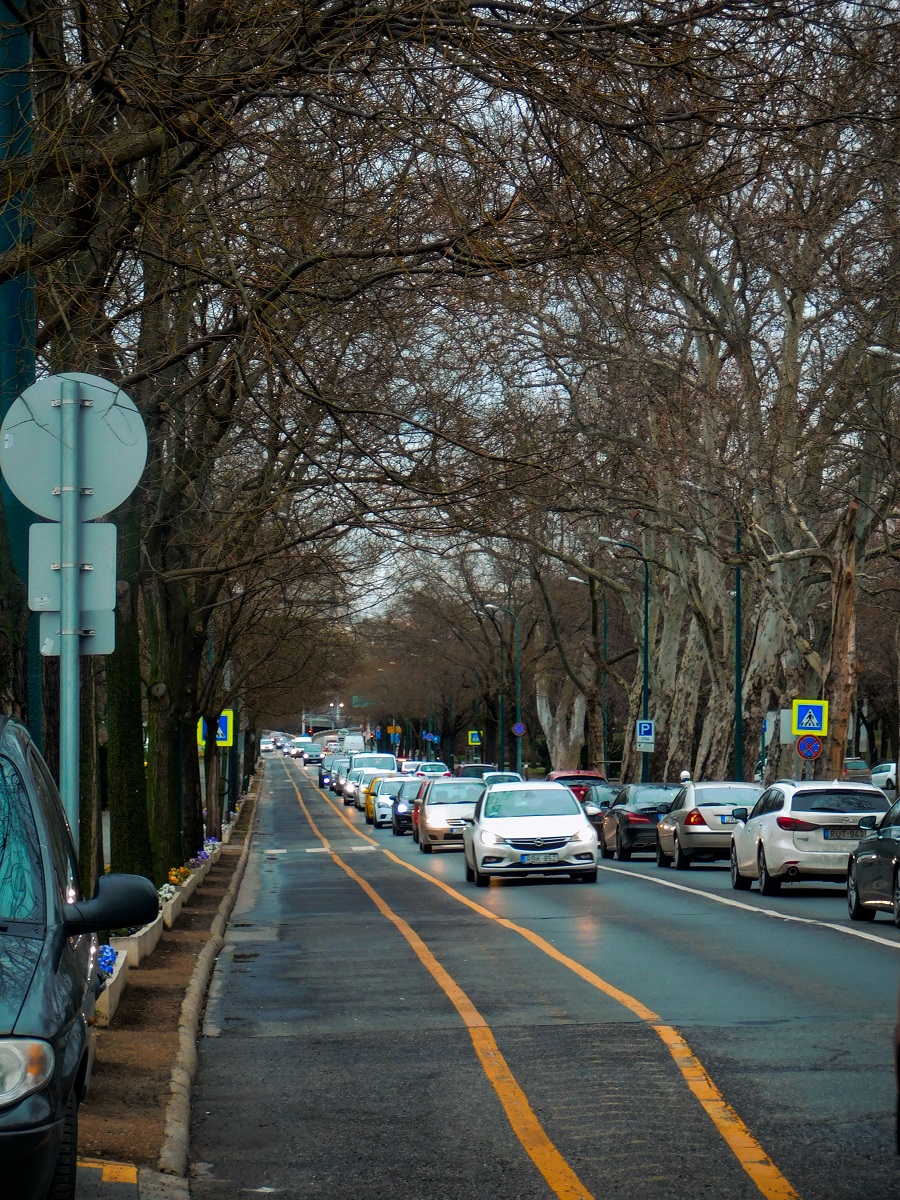
Road deaths per 100k inhabitants
The indicator refers to deaths recorded following road traffic collisions, occurring either on the spot or within 30 days of the collision.
0.62
Compare dataPrice of hourly parking
The indicator will display the amount drivers have to pay for one hour of parking in places or facilities available for public parking use in the metropolitan area. The parking places referred to are those where payment is done by the hour and in general for on-street places the maximum length of the parking duration is limited as well.
An upper and lower bound amount will be collected, reflecting the various zones and pricing policies in used in the city.
2.20
Price converted from EUR using exchange rates available on .
Motorisation rate
The number of passenger cars in the metropolitan area includes all vehicles with four wheels or more used primarily for the private transportation of persons, but does not include taxis or any form of public transport vehicle.
374 cars Per 1000 inhabitants
Compare data
Zero-emission zones
The indicator will show whether the city has defined and implemented an ultra-low emission zone restricting the access of all vehicles except for the least polluting ones from a certain area within its jurisdiction.
No
Compare dataAccess restrictions revenue
The indicator looks at the annual revenue generated by the various road pricing and urban vehicle access regulations in place in the city. General vehicle registration tax for the cars registered in the city is not considered, nor the payment for parking permits reserved for residents.
0.00
Price converted from EUR using exchange rates available on .